


Brookings Report Lists Buffalo Per Capita GDP as 19th Largest in the World
by Jay Burney
Yes, you read that correctly. The report, “Global Metro Monitor, Volatility, Growth, and Recovery 2011,” released January 18, 2012 and authored by Emilia Istrate, Alan Berube, and Carey Anne Nadeau, identifies comparisons between economic output and employment of the world’s largest metropolitan communities. This is a fascinating report that also compares “developed, undeveloped, and developing” areas and economies from around the globe and disproportionate GDP versus personal income statistics.
Key findings rom the report:
An analysis of per capita GDP (income) and employment changes in the 2010 to 2011 period for 200 of the world’s largest metropolitan economies, which account for nearly one-half (48 percent) of global output but contain only 14 percent of world population and employment, reveals that:
-Ninety percent of the fastest-growing metropolitan economies among the 200 largest worldwide were located outside North America and Western Europe.
-By contrast, 95 percent of the slowest-growing metro economies were in the United States, Western Europe, and earthquake-damaged Japan.
-In nearly every global region, metro areas generated disproportionate shares of national increases in output and employment. Many US metro areas significantly outperformed the national average on income growth, while several others significantly underperformed on employment growth.
-Most of the best performing metro economies during the recession were from developing countries in Asia, and Latin America, while the bottom performers were almost all from the United States and Europe. However, 12 of the top 20 are U.S cities.
-In nearly every global region, metro areas generated disproportionate shares of national increases in output and employment. Many US metro areas significantly outperformed the national average on economic growth while several others significantly underperformed on employment growth.
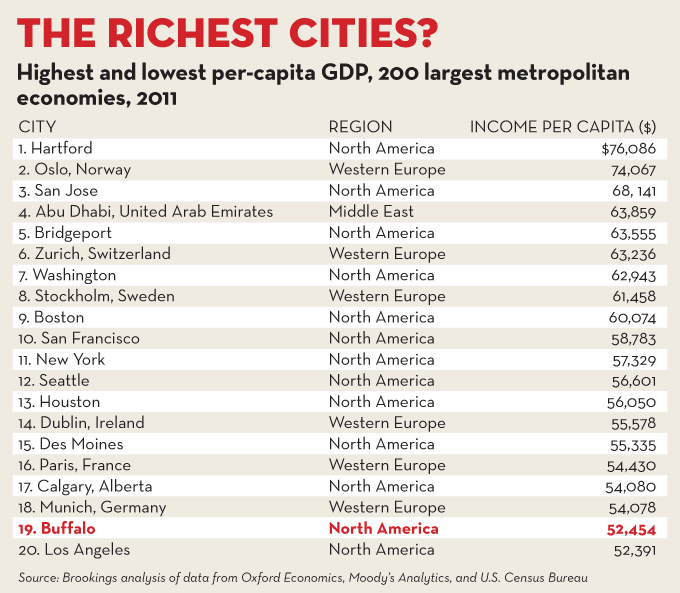
Page 6 of the full report identifies metropolitan Buffalo as having the 19th-largest per-capita GDP in the world. Hartford, San Jose, Bridgeport, Washington, DC, Boston, San Francisco, New York, Seattle, Houston, and Des Moines are all on the list before Buffalo, which is ranked just above Los Angeles.
GDP is defined as “the sum of the marker value of goods and services produced in an economy”; the Buffalo metropolitan economy is considered to include Erie and Niagara counties.
According to the report, the region’s most successful sectors are business and finance, which contribute about 45 percent; education, healthcare, administrative services, and government, which contribute a little over 30 percent; and trade and tourism, which contribute about 15 percent. Construction, transportation, and utilities define the remaining output.
According to the US Census Bureau, Buffalo is the third poorest city in the US with a population of over 250,000. Buffalo is the sixth most segregated city in the United States. The income per capita in Buffalo is 43.2 percent less than the New York average and 31.6 percent less than the national average. The median household income in Buffalo is 56.1 percent less than the New York average and 45.6 percent less than the national average. The median household income in Buffalo for owner-occupied housing is 127.4 percent greater than the median household income for renter-occupied housing in Buffalo.
The poverty level in Buffalo is 200.9 percent greater than the New York average and 116.4 percent greater than the national average. The median earnings for males in Buffalo is 39 percent greater than the median earnings for females in Buffalo.
blog comments powered by Disqus|
Issue Navigation> Issue Index > v11n6 (Valentine's Day Issue, week of Thursday, February 9) > Week in Review > Brookings Report Lists Buffalo Per Capita GDP as 19th Largest in the World This Week's Issue • Artvoice Daily • Artvoice TV • Events Calendar • Classifieds |
 Current Issue